Biomarker development research follows a continuum, from discovery to translation. At the discovery stage, high plexing capabilities and flexible analysis tools are required. As you move to translational and clinical research, it’s useful to narrow down an assay to something high throughput, standardized, and reproducible.
In a webinar featuring Dr. Cliff Hoyt, VP of Translational and Scientific Affairs, and Dr. Julia Kennedy-Darling, Director of R&D, at Akoya Biosciences, we heard how the CODEX and Phenoptics platforms complement each other and support research at all stages of the translational pathway.
A highly multiplexed imaging platform for discovery
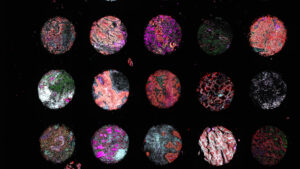
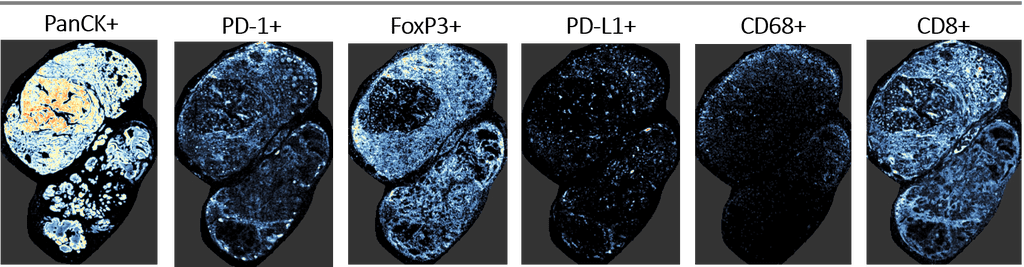
High-parameter spatial measurements are necessary to understand the full complexity of the tumor microenvironment (TME). There are a large variety of cell types in the TME, explained Dr. Kennedy-Darling. In order to view all these different cell types as well markers for different checkpoints and cell states, you need a panel consisting of almost 40 antibodies. The CODEX platform is uniquely equipped to meet this need. The technology, called “Co-Detection by Indexing”, consists of three main components: CODEX reagents, fluidics control, and CODEX software.
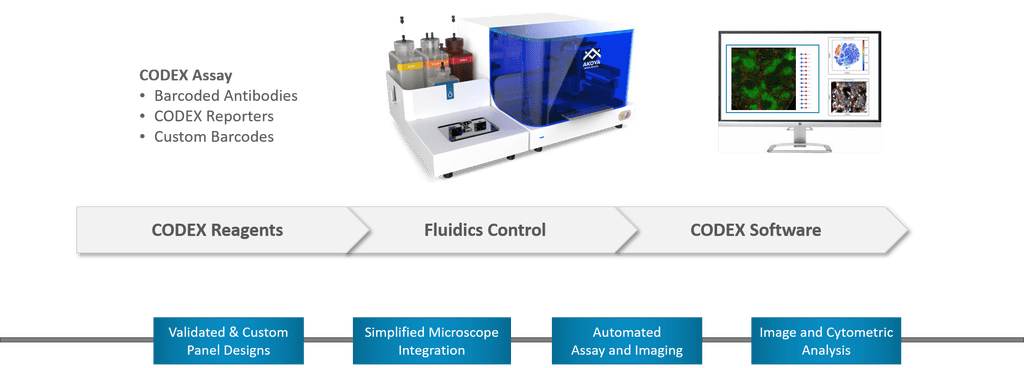
Dr. Kennedy-Darling walked us through the CODEX workflow. To start with, each antibody in a panel is conjugated to a unique oligonucleotide barcode. Barcodes are associated with paired fluorophore reporters. Reporters are recycled across multiple imaging cycles on the CODEX instrument in a fully automated process. In each cycle, three reporters are applied to the tissue, imaged, and removed with a gentle wash. The cycles repeat until all markers have been measured. CODEX software is then used to perform analysis.
The CODEX workflow includes multiple reagents and kits, which are used to automate the assays. Staining kits are used to stain the tissues before being loaded onto the instrument. Conjugation kits allow users to conjugate their own custom antibodies in addition to our pre-defined inventory. Additional buffers and reagents are also used for loading onto the instrument.
Dr. Kennedy-Darling detailed how the CODEX instrument works. CODEX is an automated fluidics manipulator that integrates with existing microscopes. This integration is both hardware and software based. On the hardware side, there are specialized stage inserts which sit within the geometry of the microscope units. The tissue sample is sandwiched between two gaskets connected to the inserts to form a sample well. Fluidics manipulation occurs on top of the tissue and is fully automated using the associated control software.
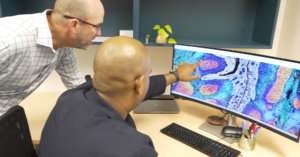
CODEX software consists of the CODEX Instrument Manager (CIM), CODEX Analysis Manager (CAM), and the Multiplex Analysis Viewer (MAV). CIM controls the instrument and image acquisition across the multiple microscopes we integrate with. CAM is used for image processing, including drift compensation, image segmentation, deconvolution, and stitching. MAV allows you to extract biological meaning from data sets through cell clustering. In MAV, you can manually annotate cells and re-map the annotated cell types onto the tissue image.
“The CODEX platform is well-suited for these discovery applications,” said Dr. Kennedy-Darling. “To understand the complexity of the tumor microenvironment, you really need a high parameter measurement to be able to measure these cells and where they are in relation to each other.”
The translational platform for predictive biomarkers
The Phenoptics platform is ideal for more specific, high-throughput, hypothesis-driven assays. This platform consists of reagents, imaging instruments, and analysis software.
Dr. Hoyt provided an overview of the new features in Phenoptics 2.0. The Vectra Polaris instrument uses a new technology, called MOTiF, which enables whole slide multispectral imaging. MOTiF enables fast scanning – you can acquire 7-color multispectral imagery of a 1.5 x 1.5 cm area in under ten minutes. The multispectral imaging technology eliminates autofluorescence and removes spectral cross talk. It’s also important to note that the entire slide can be imaged using multispectral imaging.
“The main advantage of MOTiF is that now the whole slide has been images multrispectrally, so you don’t have to go back and select specific fields to focus multispectral imaging on,” said Dr. Hoyt.
With Phenoptics 2.0, there are also two new Opal fluorophores available, Opal480 and Opal780. These two dyes are part of the MOTiF scanning approach. They can be used to replace existing dyes in a classic Opal 7-color assay, or they can be added to a classic 7-color Opal assay for 9-color region-based analysis.
Image analysis has also shifted to support whole-slide imaging, explained Dr. Hoyt. In Phenochart, you can now draw manual regions of interest (ROIs) instead of the previous rectangular field-based approach. Cell coordinates are now slide-based instead of field-based, generating contiguous data rather than data based on individual fields.
Finally, the R scripts and graphical user interfaces are available for free download from GitHub. These can be used to help merge inForm data and provide quantitative assessments of Opal staining protocol performance.
Dr. Hoyt then went through some examples of imaging using the MOTiF assay. The first was a head and neck tumor section. While inForm generates data output tables, for the cells, R scripts can be used for further analysis, like cell density heat maps, as shown below.
Cell density maps generated from MOTiF assay in head and neck tumor section
To understand the biology behind cell interactions, it is also possible to generate density maps of cells expressing more than one biomarker and maps showing the density of cells within a certain distance of other cell types.
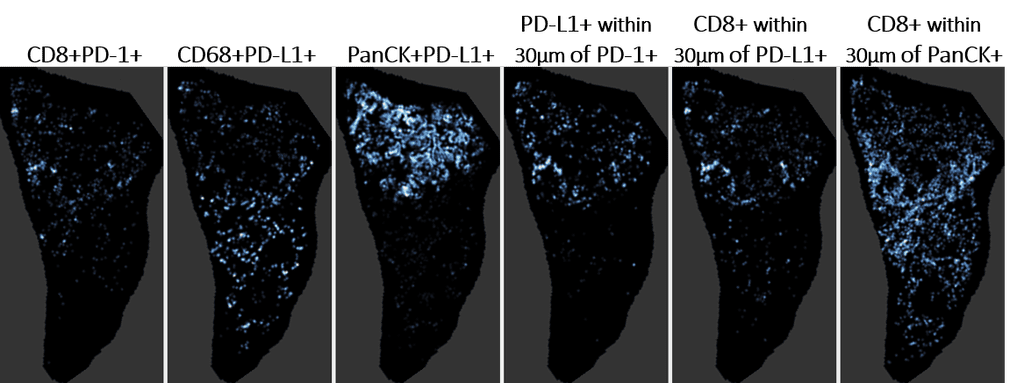
Cell density/proximity maps generated from MOTiF assay in lung cancer section.
CODEX and Phenoptics – The perfect complement
The CODEX and Phenoptics platforms work well in combination with each other. CODEX enables biomarker discovery, allowing you to probe most if not all proteins of interest in a single section. Using this platform, you can discover co-expressions, cellular compositions, and spatial arrangements. CODEX comes with a comprehensive software suite to enable image visualization and statistical analysis.
Phenoptics excels in moving biomarker discoveries to larger validation studies in FFPE, once key proteins have already been identified. The platform is high-throughput, established, and analytically validated, hitting key requirements for translational research. The amplification and unmixing technology of Phenoptics allows for signal balancing, dynamic range, faster scanning, and autofluorescence removal. Both platforms in tandem allow for a comprehensive biomarker development solution at all stages of the translational pathway
Click here to watch the on-demand webinar.