Building an organ atlas is an important but very difficult job. Organ atlases aim to catalog all the cell types and subtypes throughout the human body while also mapping their location, architecture, and function. This process is a bit like going on a very very long road trip. You must carefully plot your course, think about what pit stops you will make along the way, who will be riding in the car with you, and what car you will decide to drive. Below I have laid out what I think are six key considerations when deciding how to start, what challenges may arise, and what the future of creating cell atlases may look like.
1. Maps are complex
Imagine you are driving on a highway, and your GPS is attached to your windshield. You see the icon that represents your car passing over a bridge with water underneath, when you look out the window, what do you expect to see? I would imagine the answer to this question is your car driving over a bridge with water underneath. It seems so simple, but we take this entire process for granted. The effort that went into a picture accurately representing the real world is truly incredible and it has likely been ongoing since humans could draw. Next time you look at map take some time to think about everything that went into it such as mapping elevations, waterways, roads, forests, trails, cities, structures, and the list goes on. An atlas is a book of map. Of course, a very basic map would be a globe, but the more we zoom in the more things we realize we need to map, and eventually we have hundreds and thousands of maps. The concept of mapping can be applied to our bodies. At a high level we can map how we look on the on the outside, but as we zoom in, we increase the level of complexity. The body is made up of 79 organs (that we know of at least), each representing a collection of tissue that form specialized units that perform specific functions. Our organs are composed of various cell types that can also be further subdivided into discrete subpopulations, and these cell types are immensely diverse in their respective functions including epithelial cells, stromal cells, nerve cells and immune cells, to name a few.
2. Maps change
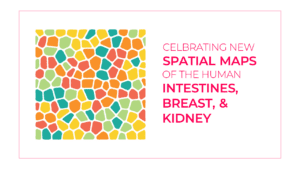
Rivers meander, lakes dry up, cities get built, new roads get paved, and when these things happen, we must update our maps. The human body is not that much different. The makeup of our bodies differs by age, disease, and sex. Different maps will have to be created for different groups of people. A study published this year titled Highly Multiplexed Immunofluorescence of the Human Kidney Using CODEX by Elizabeth Neumann et. al. dives into the differences in mapping healthy vs. diseased kidenys. As the title suggests, the study focuses on the efforts surrounding the mapping of the kidney but namely it compares the cellular diversity in healthy humans vs. those with diabetic nephropathy using high-plex imaging with the PhenoCycler™ instrument. Briefly, the PhenoCycler technology (formerly CODEX) works by using antibodies conjugated to proprietary Akoya Barcodes, comprised of a unique oligonucleotide sequence. The PhenoCycler Assay targets specific barcodes with a dye-labeled Reporter (complementary oligonucleotide sequence to the Barcode) for highly specific detection. After the tissue is stained with the entire PhenoCycler antibody panel in a single step, 3 Reporters are added in each cycle to reveal 3 markers at a time. After each cycle, the Reporters are gently removed and washed away and the cycle repeats until all the markers on the panel are revealed in the tissue. This method is uniquely suited for the mapping of diverse cell types housed within various structures of whole organ tissues. What the authors found was that patients with diabetic neuropathy have substantial reorganization of cellular neighborhoods. These finding are a key indicator that every organ will not just require a map, but an atlas.
3. Think small to start
Based on what has been said in the above two points, its important to set your sights on smaller goals, because things can get out of hand quickly. Organs can be physically quite large, and this means lots and lots of cells, it can also mean lots and lots of functions. Let us take the colon for example, the colon is an extremely complex organ with involvement in digestion, absorption of nutrients, immune surveillance, balancing our microbiome, and promoting general health. The cells that exist within the colon include immune cells, epithelial cells, stromal cells, and nerve cells, each able to be further subdivided into specific categories. In a study by John Hickey, et al., titled High Resolution Single Cell Maps Reveals Distinct Cell Organization and Function Across Different Regions of the Human Intestine, the authors set out to map various portions of the intestine using PhenoCycler technology. Eight regions of the intestines were analyzed in which data on spatial coordinates of cells, cell types, spatial interaction and relationships, and overall function were assessed. The authors conducted multicellular neighborhood analysis and analysis of hierarchical structures. Through this study the authors demonstrated the extensive cellular complexity of the small intestine including considerable epithelial heterogeneity and novel secretory cell subtypes, they also point out that different regions of the intestine have different cell compositions, and that cells are organized into different neighborhoods that also form communities. Investigating a single organ or region of an organ may seem like a small task in the beginning but once the research begins, be prepared to make new discoveries, uncover novel interactions, and find that the organization of the organ may be more complex than anticipated.
4. Be prepared for the long haul
Mapping projects take a very long time to complete. Do you remember The Human Genome Project? The project was an international effort to determine the base pairs that make up the entirety of human DNA as well as mapping and sequencing all physical and functional genes across the human genome. The projects inception began in 1984 and was declared “complete” in April of 2003. The project involved 20 institutions, companies, and laboratories across the world and required a multidisciplinary effort including genomics scientists, bioinformaticians and computer scientists. “Completion” of the sequencing took about 13 years. Yes, we can argue that if we did the same project again today it would move much faster due to the advances in computing and instrumentation and so on, but the reason I put completion in quotes is because that 13-year span actually only included about 92% of the human genome (euchromatic regions to be specific) and did not include heterochromatic regions. It was not until April 2022 that 99% of all regions were sequenced. So, when I say be prepared for the long haul, I mean it. There will be technological limitations that slow you down and over time those hurdles will eventually be crossed, but the other issue is that with technological advancement comes discovering more of what you do not know. You may find you and your team going back to the drawing board and figuring out what adjustments need to be made to your existing maps.
5. Who are your copilots?
There are three major consortia that are considered the global leaders in cell atlas efforts: the human BioMolecular Atlas Program (HuBMAP), the Human Tumor Atlas Network (HTAN), and the Human Cell Atlas (HCA). Each consortium focuses on a specific goal with respect to their atlas efforts. HuBMAP is an organization that develops open-source analysis technologies and computational tools that enable the generation of 3D tissue maps and construction of an atlas of the functional relationships among all the cells in the human body. HTAN is an initiative focused on constructing 3D atlases of the cellular, morphological, and molecular features of human cancers as they evolve from precancerous lesions to advanced disease. They aim to define critical processes and events throughout the life cycle of human cancers, such as the transition of pre-malignant lesions to malignant tumors, the progression of malignant tumors to metastatic cancer, tumor response to therapeutics, and the development of therapeutic resistance. HCA is an international group of researchers using a combination of these new technologies to create cellular reference maps with the position, function, and characteristics of every cell type in the human body. The atlas effort is dynamic and requires expertise in a variety of areas, each exposed to unique challenges, it is up to you to when deciding which consortia will best help cultivate your research interests and which challenges you want to tackle. Check out this three-part webinar series where we sit down with HuBMAP researchers to discuss the building of spatial maps, get the inside scoop on their tissue mapping centers, and have a round table discussion with the experts to discuss challenges, accomplishments, and the future.
6. Choose your method of travel wisely
When I say, “method of travel”, I am referring to the technologies you choose to map your organ of interest. Like I explain in points three and four, organ mapping is a long and complicated journey, and there are many ways to do it. I want to take the time to explain how Akoya’s PhenoCycler-Fusion technology is up for the task. Immunohistochemistry (IHC) is generally considered the gold standard for labeling cell types and structures within a tissue due to its high specificity and the insights it can provide for a wide variety of proteins and biochemical pathways. Fluorescently tagged antibodies are also commonly used due to their low background for high signal-to-noise imaging. However, fluorescence experiments are limited to seven biomarkers (low plex) due to spectral overlap between fluorophores. To increase plex to 20-60 markers we can used cyclic multiplexed immunofluorescence (IF), which consists of antibody application, imaging, then fluorescence inactivation or bleaching before beginning a new cycle. The issue with IF is after each cycle the tissue will become degraded, so with increasing plex we end up ruining our precious tissue and the images collected in later cycles may have their integrity in question. PhenCycler-Fusion technology targets specific barcoded antibodies with a dye-labeled Reporter (complementary oligonucleotide sequence to the Barcode) for highly specific detection but maintains tissue integrity across the imaging of >100 biomarkers. The PhenoCycler can therefore provide ultrahigh-plex imaging data across much larger tissue (on the order of mm2) which makes this technology uniquely suited for exploring the cellular heterogeneity across large and complex organs. To learn more about the PhenoCycler-Fusion technology here are 10 reasons to get excited about using this solution in your research.
Author: James DeRosa, MPH